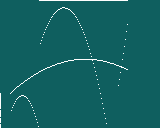
Parametric Graph Plotter
5
Graphing freedom!
Open In Editor
How to use
- Edit the program to insert a graph
- Before typing a graph, comment out the graph which draws ellipses
Explanation of vars
- T is the time variable of the parametric function
- X1 and Y1 are the coordinates of the first tap by the user
- DX and DY is the difference between the coordinates of the first tap and the coordinates of the current touch position
Note
- This is basically my paint program, but slightly modified


